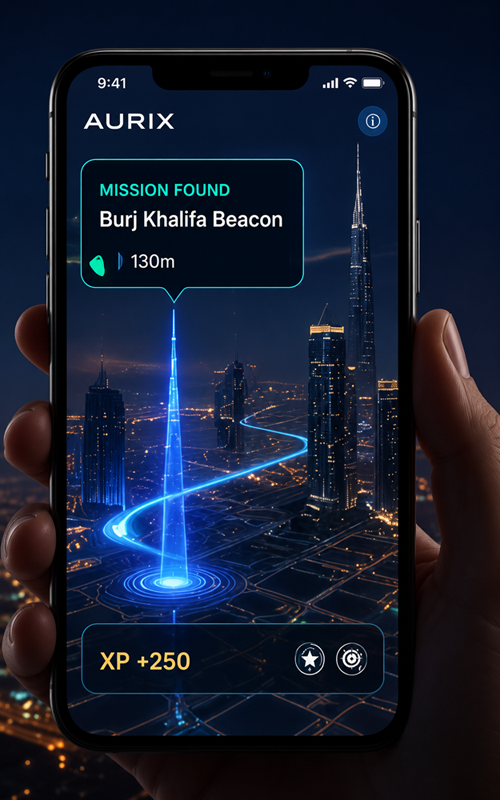
EXPLORE EXPERIENCES
Discover immersive adventures across Dubai. Play, explore and unlock.
→

Destination Intelligence & Engagement Infrastructure
The first destination intelligence platform for high-footfall environments. Turning urban movement into Measurable Engagement, Behavioral Data, and Institutional Value.
Drive participation & dwell time.
Real-time behavioral insights.
Value for every stakeholder.
"Not just an AR app - a behavioural intelligence layer for cities."
How AURIX scales across key stakeholders
Destination analytics, aggregated visitor insights, policy alignment, and data-led strategic planning.
Enhance precinct dwell time, activate underutilized spaces, and strengthen tenant ecosystem integration.
Ticket-integrated interactive missions and contextual, non-intrusive venue discoverability.
Secure APIs, architectural system integrations, and collaborative spatial hardware node deployment.
Long-term place-making intelligence and experience-driven asset valuation.
Measurable, aggregated campaign reach and interactive brand narrative performance.
Contextual guest engagement, experiential loyalty loops, and digital concierge integrations.
Gamified exploration, regional reward tiering, and privacy-first immersive journeys.
One platform. Many stakeholders. Measurable impact.
An interactive rendering of the custom edge hardware layer. This physical node encapsulates advanced proprietary optical tracks and real-time pass-through telemetry designed to deploy high-fidelity mixed reality environments seamlessly across spatial venues and smart destination infrastructure.
Model: H-Layer XR Spatial Headset v2.0
INTERFACE_MODE: USER_CONTROLLED
RENDER_TARGET: SECTOR_04_MAP
Simulation Mode: This interface is for demonstration purposes only (Future-State Model).
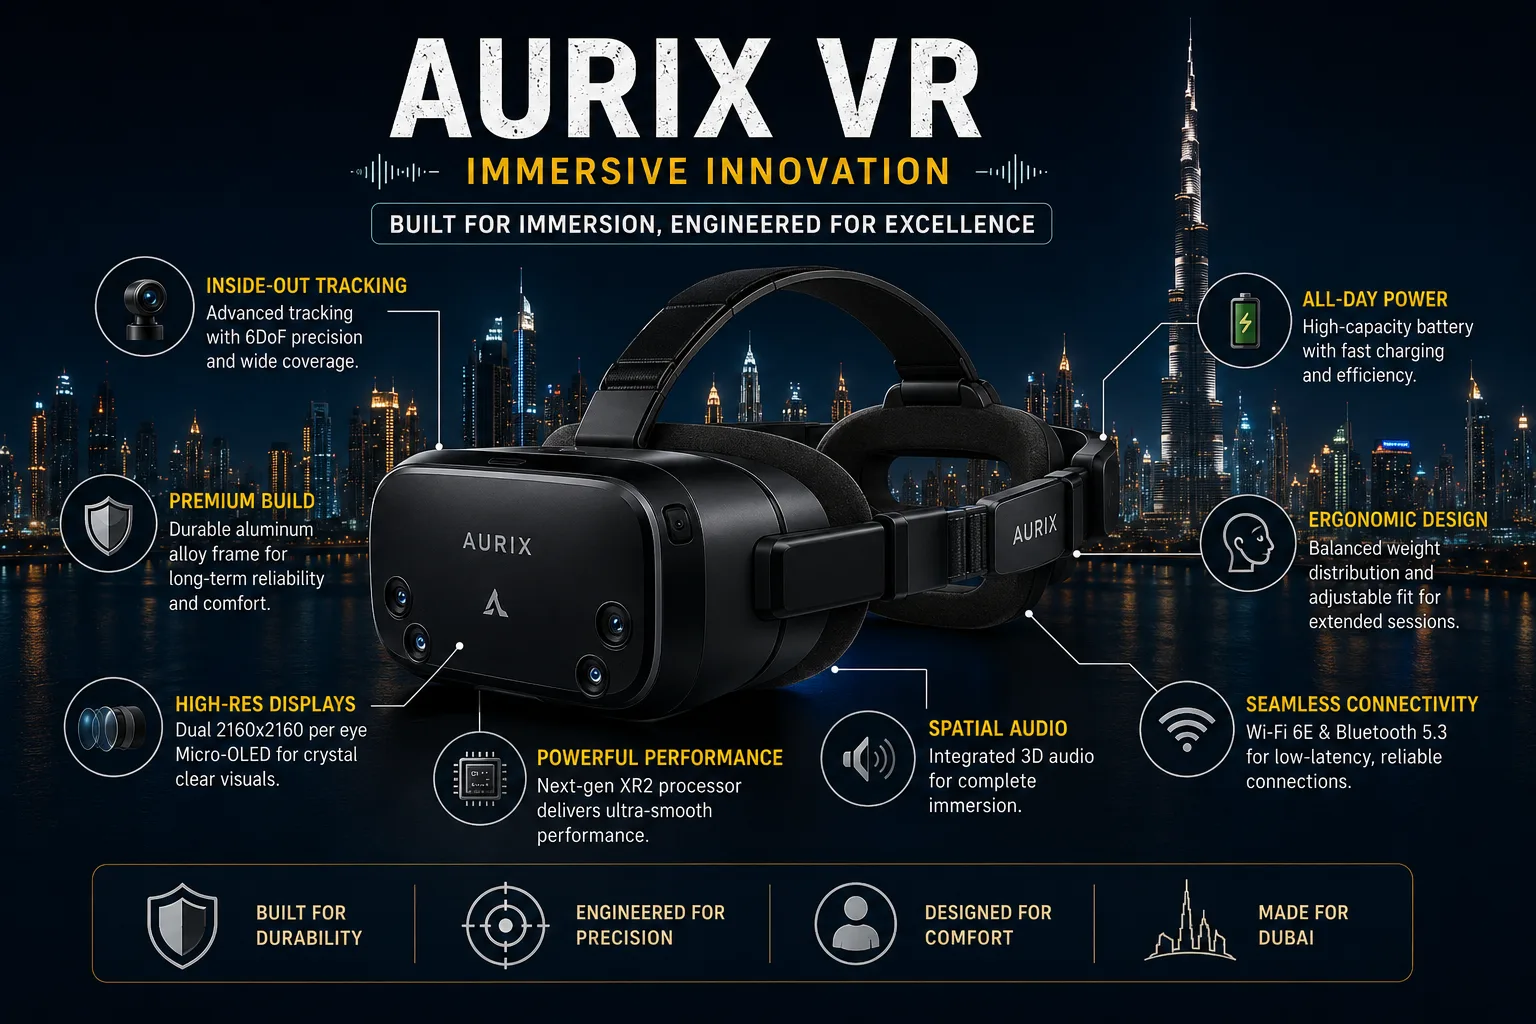
Hardware Integration
Integration with standard VR Smart-Glasses allows users to visualize precinct maps and public data layouts in high-fidelity augmented reality. Critical performance indicators and contextual orientation matrices are projected directly into the active viewport.
Latency
Ultra-Low
Field of View
Wide Coverage
Sync Mode
6DoF Sync
Status
Operational
| Specification | Details |
|---|---|
| Inside-Out Tracking | Advanced spatial positioning with 6DoF precision for seamless environmental rendering. |
| Premium Build | Durable aluminum alloy frame for long-term reliability and comfort. |
| High-Res Displays | Dual 2160x2160 per eye Micro-OLED for crystal clear visuals. |
| Powerful Performance | Next-gen XR2 processor delivers ultra-smooth performance. |
| Spatial Audio | Integrated 3D audio for complete immersion. |
| Seamless Connectivity | Wi-Fi 6E & Bluetooth 5.3 for low-latency, reliable connections. |
| Ergonomic Design | Balanced weight distribution and adjustable fit for extended sessions. |
| All-Day Power | High-capacity battery with fast charging and maximum power efficiency. |
Select your path to initialize engagement
Select the environment corresponding to your objective to initialize the application pipeline. Access is strictly governed: upon profile submission, your request enters a manual integrity review phase. Secure ecosystem credentials will be issued immediately following successful verification.
For users, visitors & explorers. Initialize live interaction environment.
For business owners, venues & mega-districts. Request operational scale data.
For capital allocation partners. Review telemetry compounding asset metrics.
Deploy contextual discovery routes, manage programmatic target structures, and analyze aggregated session metrics within a secure destination management interface.
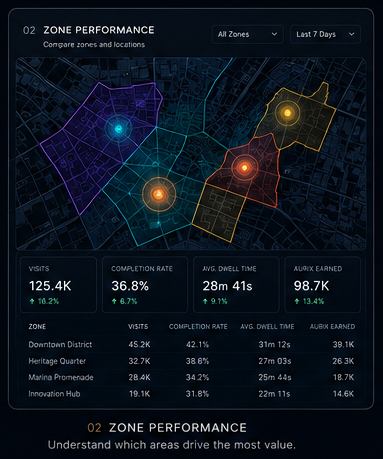
Evaluate aggregated dwell-time patterns and general engagement velocity across specific deployment zones.
Programmatic deployment logic for destination vouchers, access credentials, and tailored brand incentives based on active user-session triggers.
Monitor core system engine parameters, active target matrices, and structured interaction loops inside the gamified layers of the framework.
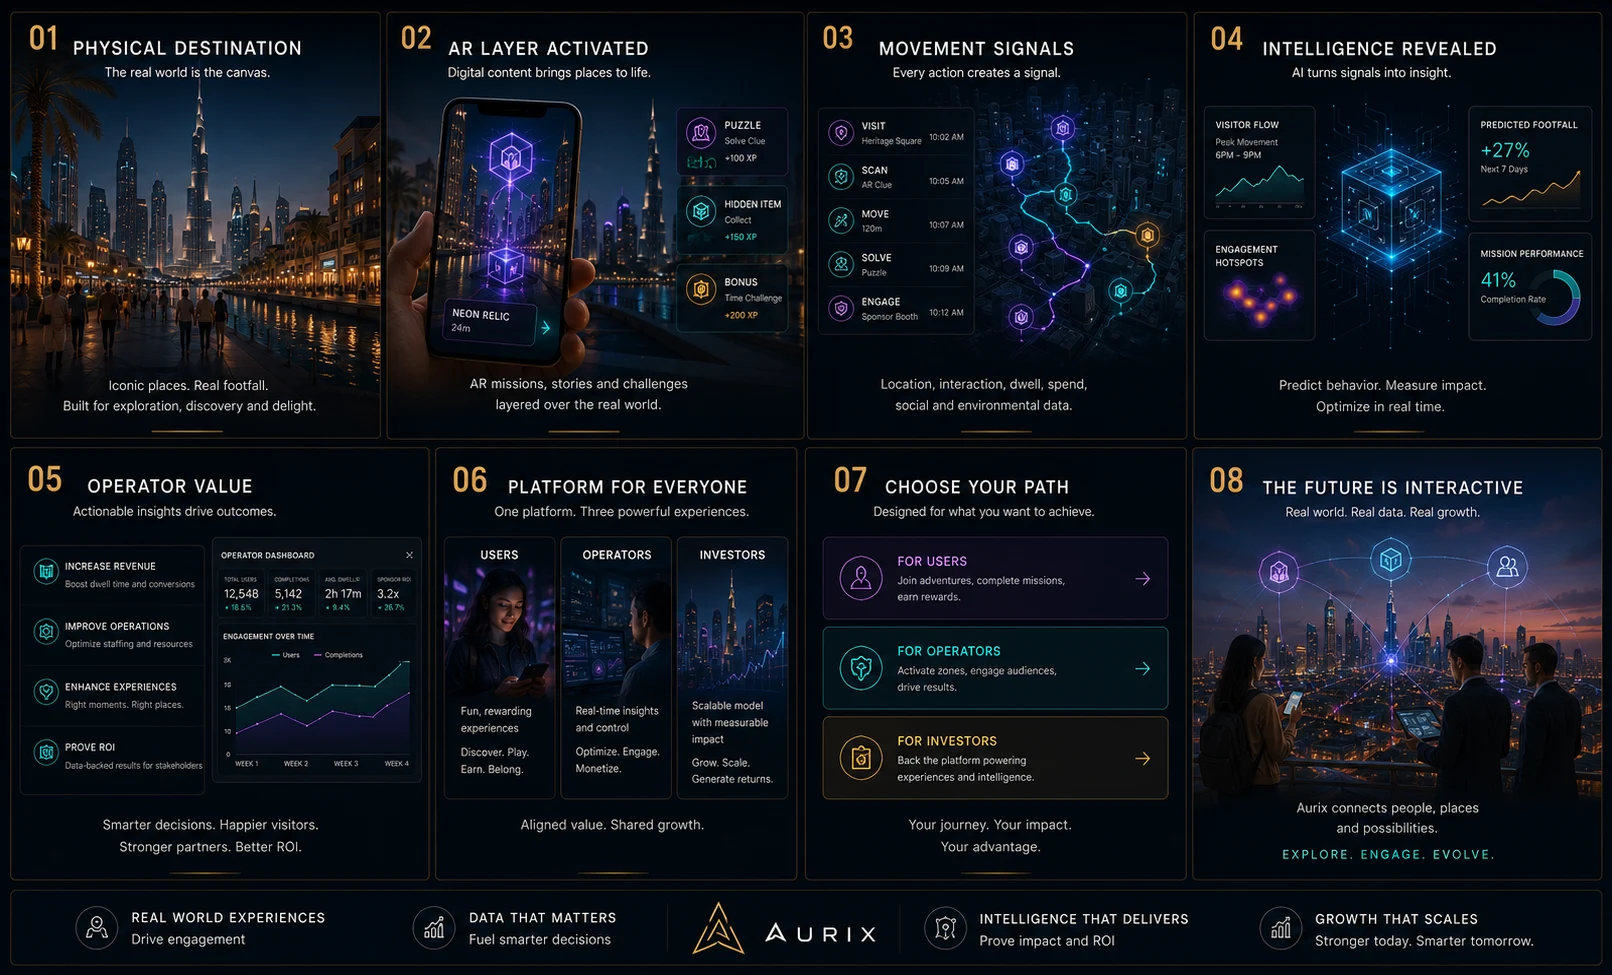
Synchronizing physical venue perimeters with high-retention spatial narratives natively inside premium global destination districts.
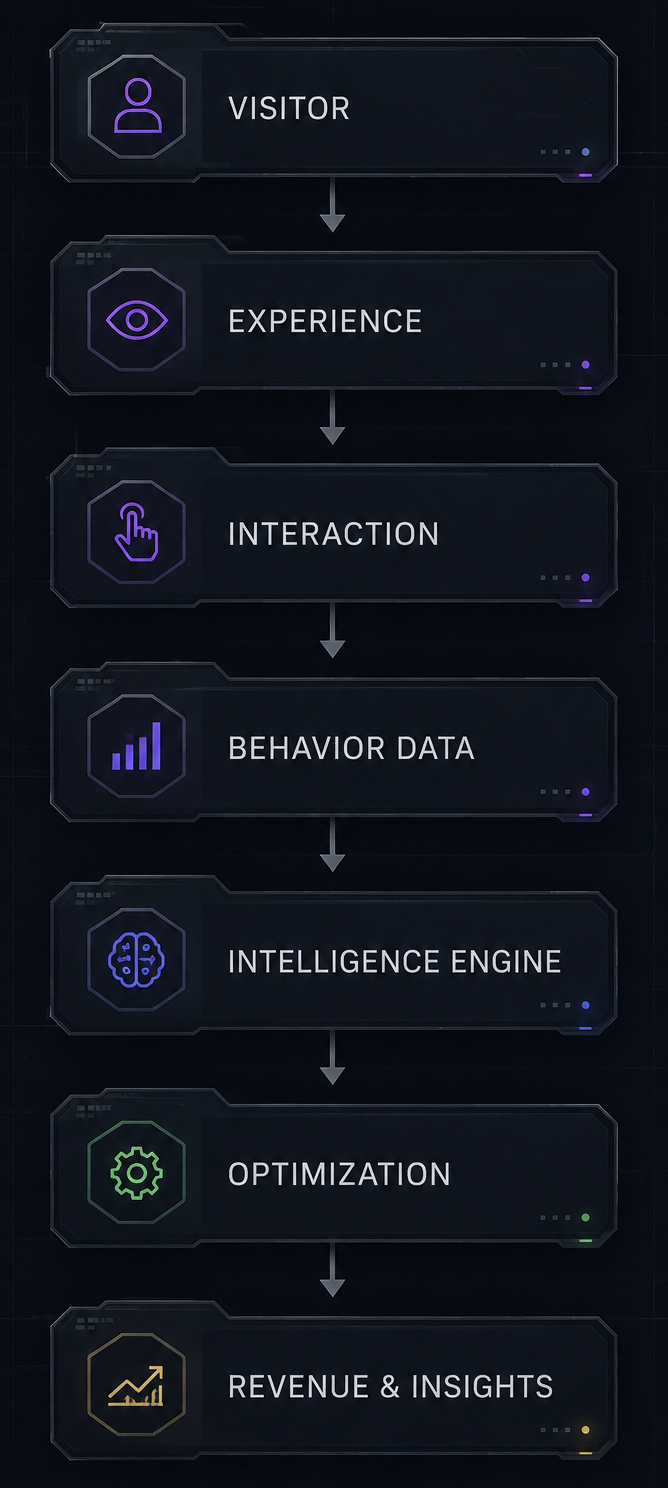
The real world is the canvas. Iconic spaces. Real footfall. Built deliberately for active exploration, discovery, and digital delight inside premium districts.
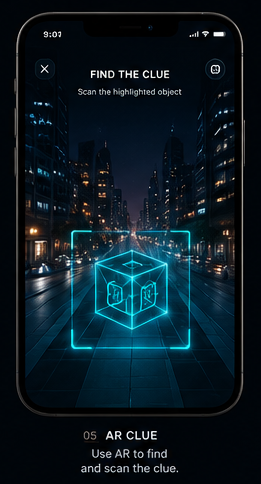
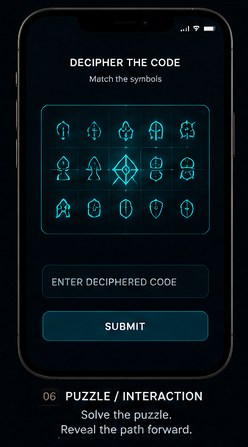
Digital content brings places to life. Gamified missions, structured puzzle coordinates, and historical challenges layered seamlessly over real architecture.
Every active session builds an aggregate vector. Processing intentional physical presence, spatial interaction metrics, dwell time, and voluntary content exposure.
AI patterns translate signals into clean operational insights. Predict macro visitor movement vectors, measure localized narrative impact, and support asset decisions based on verified trends.
Actionable insights drive decisive venue outcomes. Drastically boost user dwell-time parameters, optimize structural resources, and prove concrete, data-backed ROI for asset stakeholders.
One underlying core architecture orchestrating three powerful, intertwined experiences: Reward-fueled journeys for Users, control metrics for Operators, and scalable value for Investors.
Designed strictly around your unique operational goals. Engage with clear choices: Join discovery layers as a User, activate custom districts as an Operator, or review infrastructure growth as an authorized partner.
Real world. Responsible measurement. Real compounding growth. Aurix securely connects high-value audiences, premium physical locations, and integrated reward mechanics. Explore. Engage. Evolve.
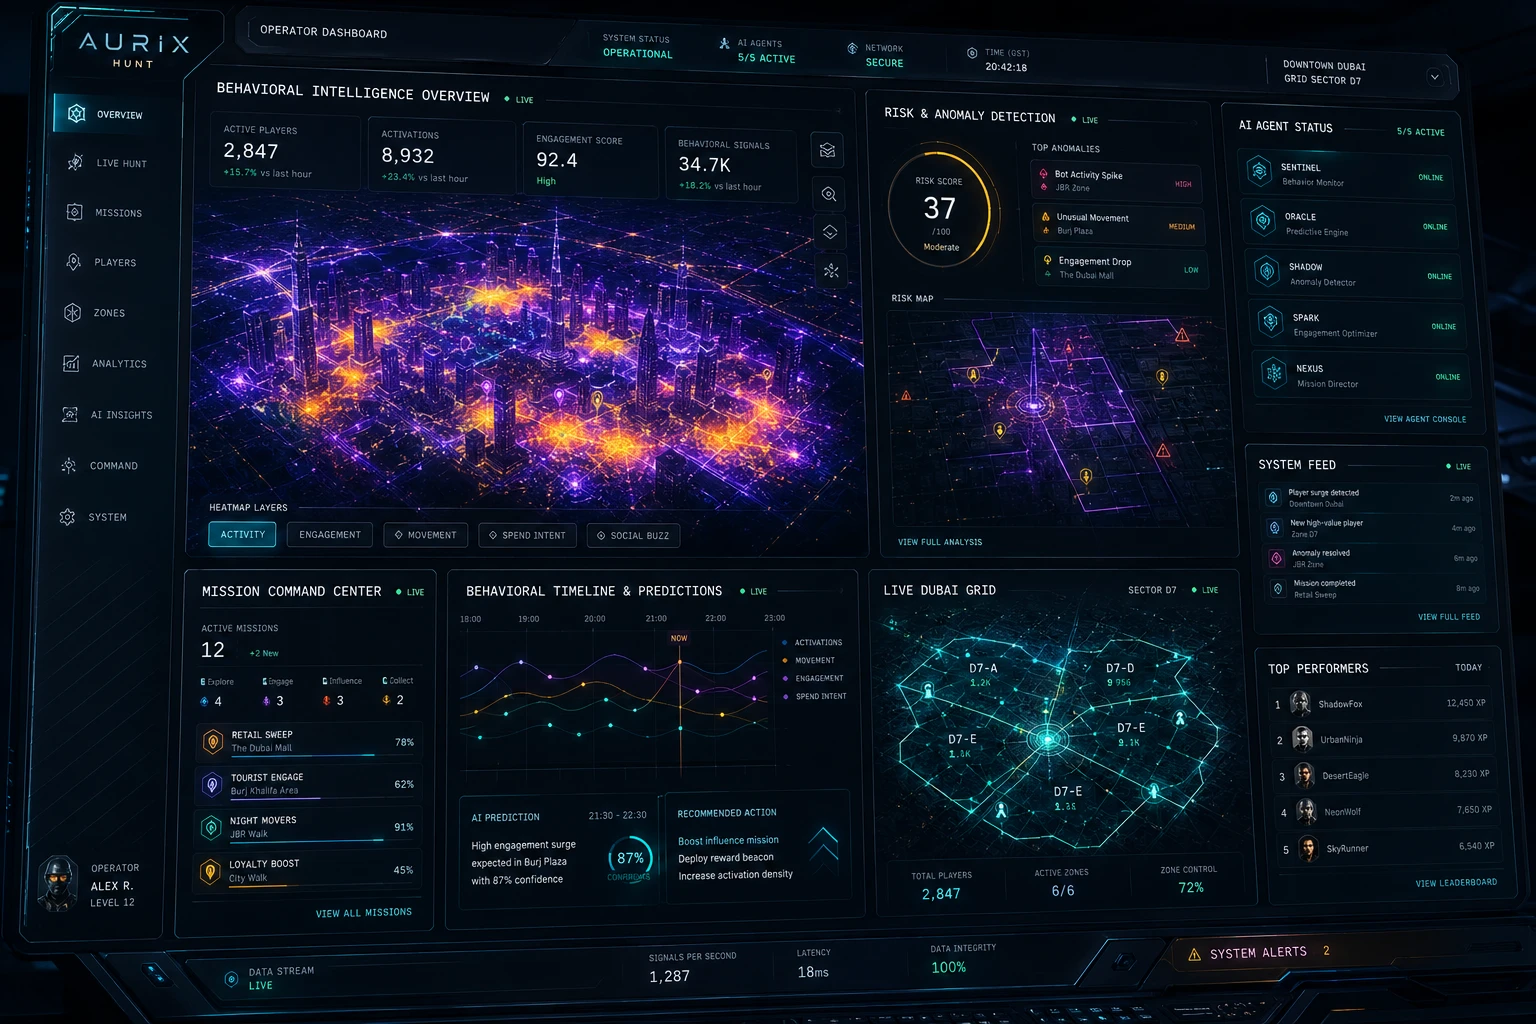
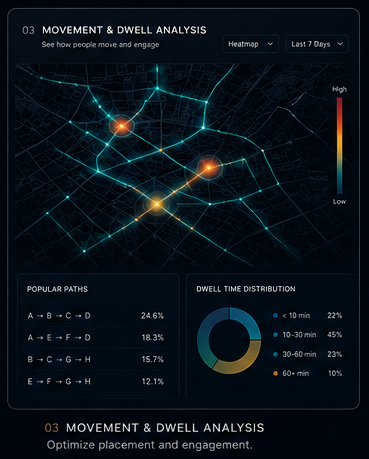
Transforming anonymous visitor dwell-time into structured, actionable insights for your destination. Here are the 6 core dimensions your operator control panel displays.
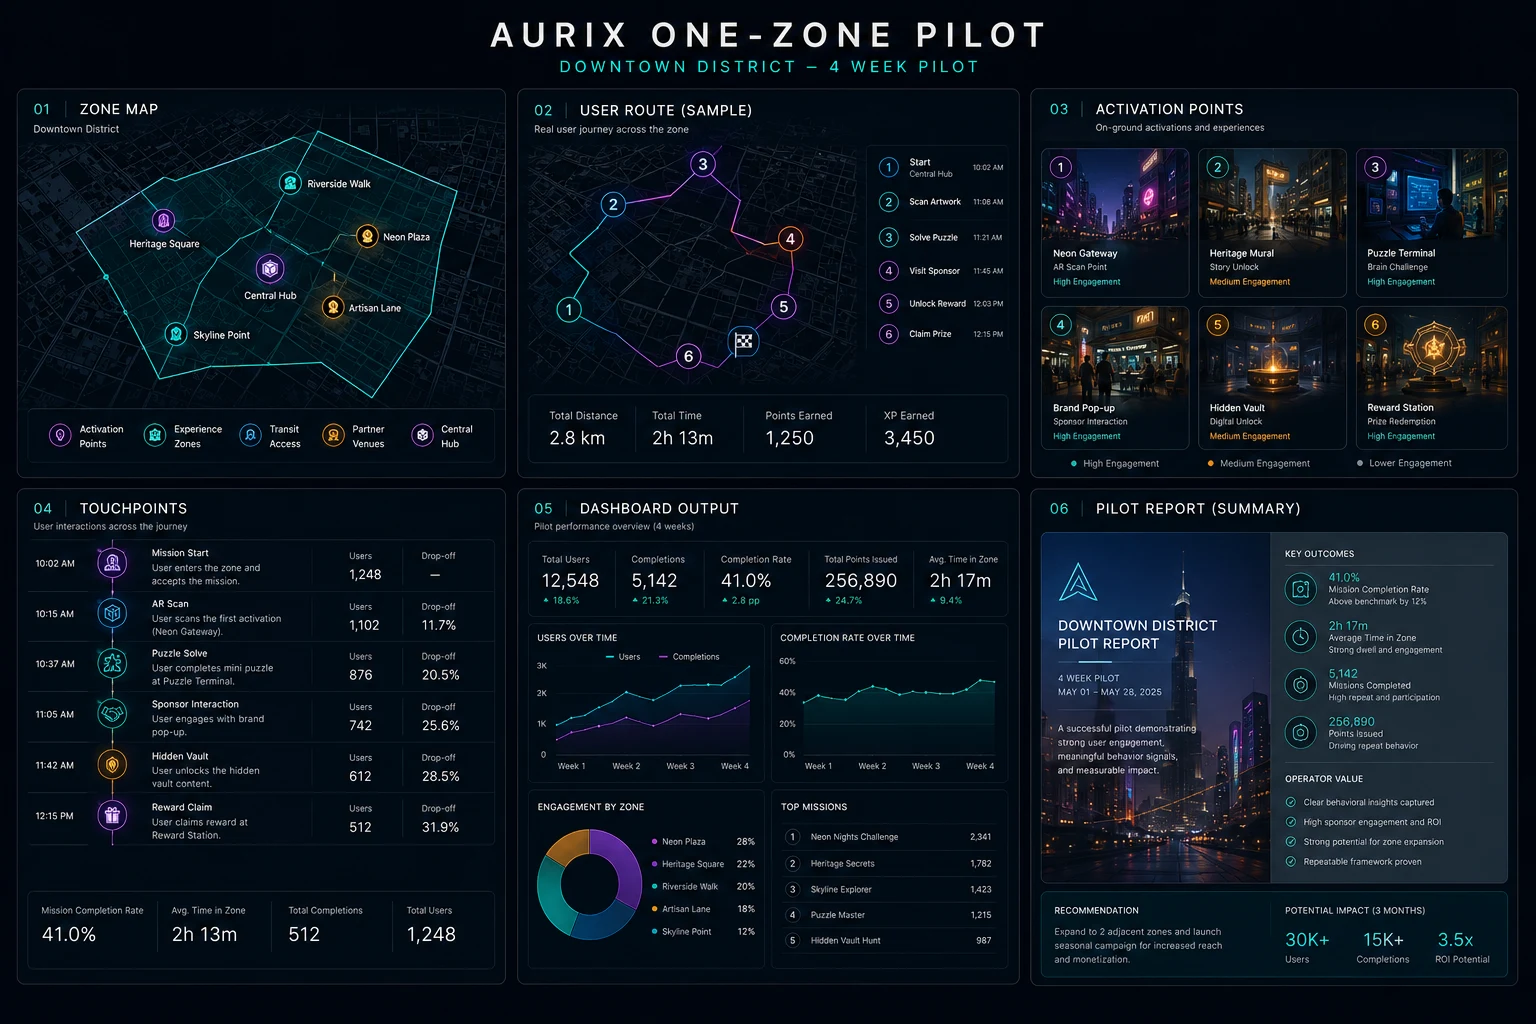
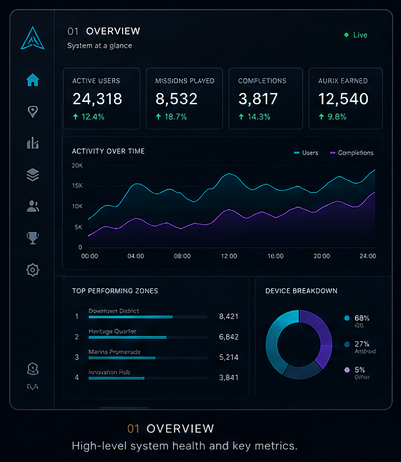
High-precision macroscopic view displaying aggregate activation density, key infrastructure points, and global ecosystem health inside the selected sector.
Anonymized mapping of typical visitor journeys across the zone, showing aggregated distance metrics, average duration vectors, and highly frequented experience paths.
Macro-level availability status of active AR locations, historical storytelling vaults, local partner venues, and interactive reward stations distributed across the grid.
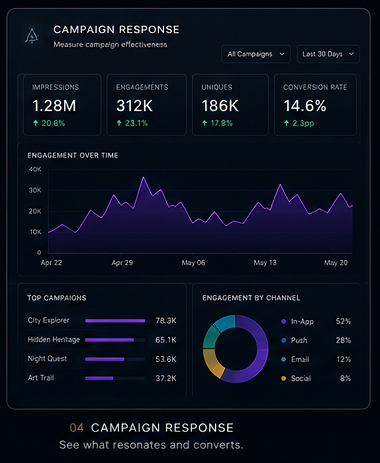
Anonymized macro funnel analysis charting structured visitor touchpoints-from discovery initiation and AR scanning to partner integration loops and reward claims.
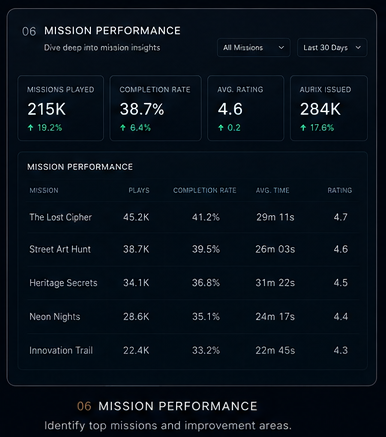
The global framework performance center. Aggregates total active district interactions, complete challenge execution rates, volume of digital platform items unlocked, and overall visitor destination exposure.
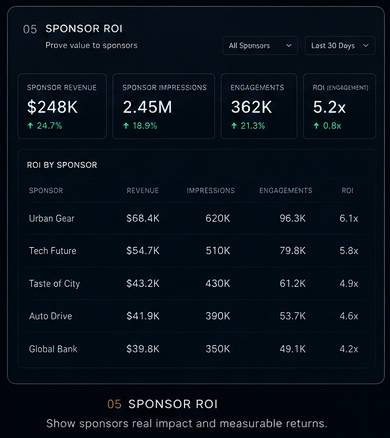
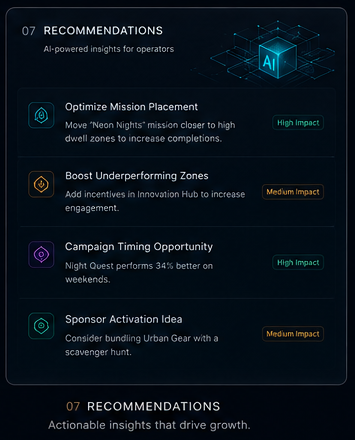
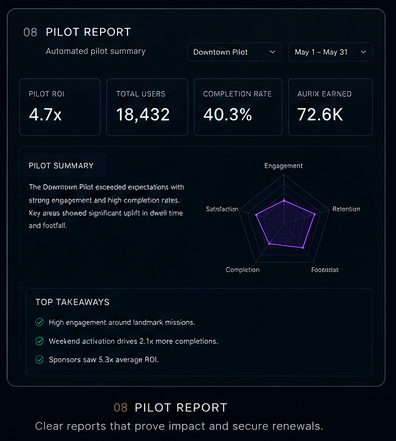
Automated B2B stakeholder report engine. Synthesizes behavioral trends into structural operator recommendations, regional engagement strategies, and localized real-estate ecosystem integration value.
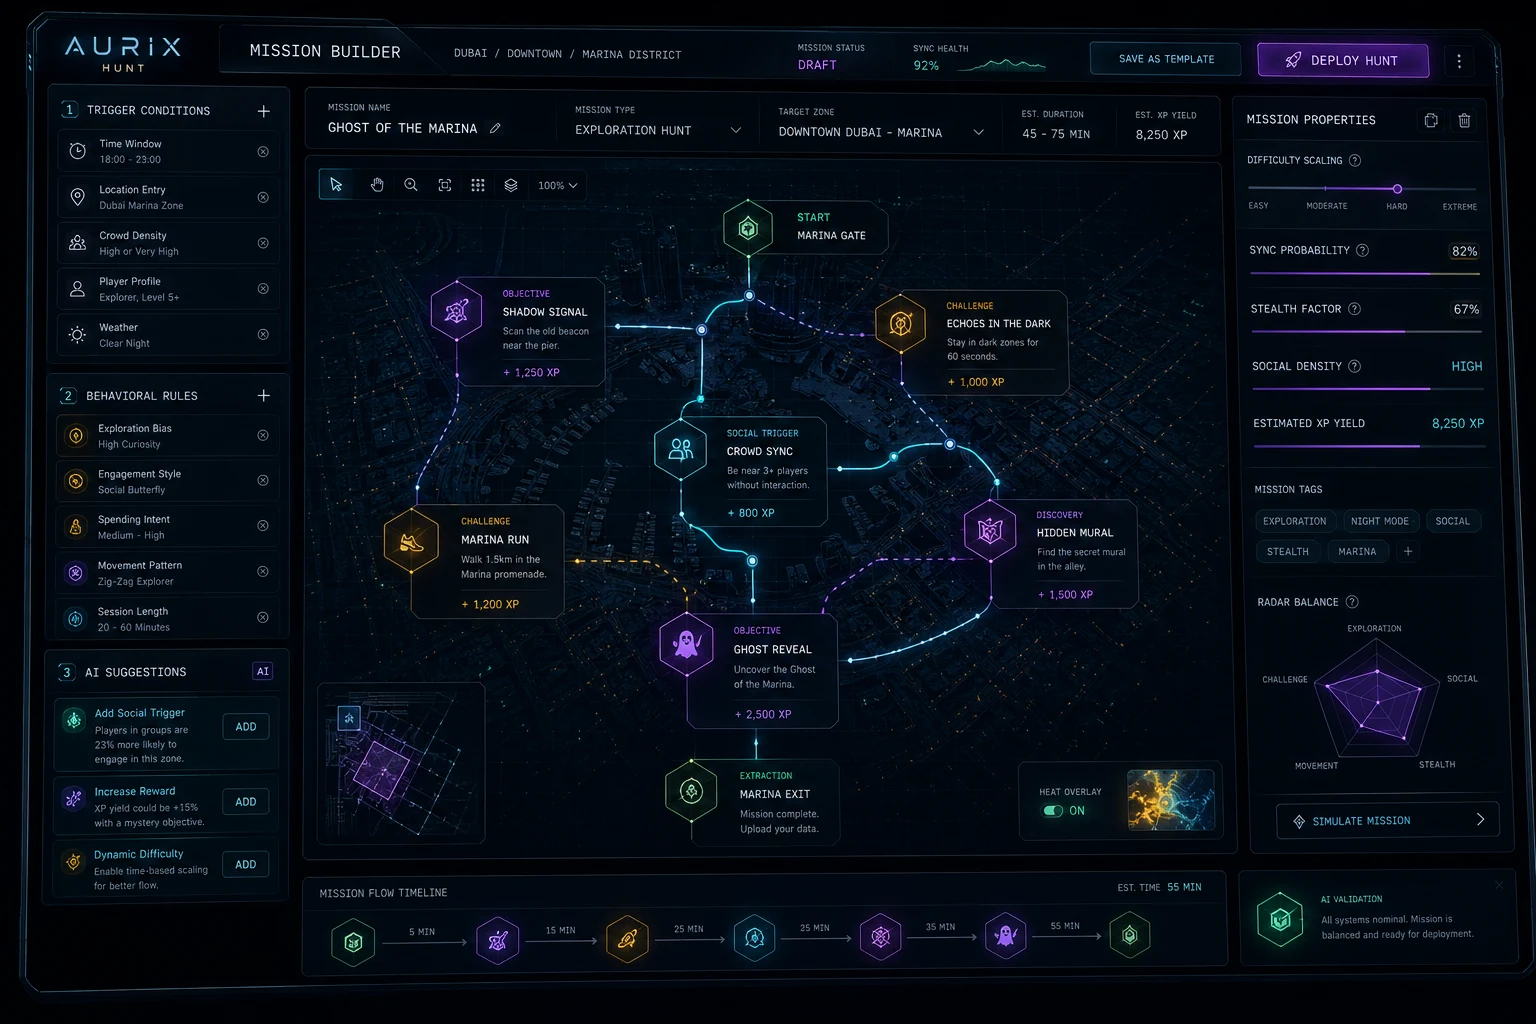
Empowering district operators and brand partners to architect, target, reward, and publish geo-spatial AR campaigns through an automated dashboard.
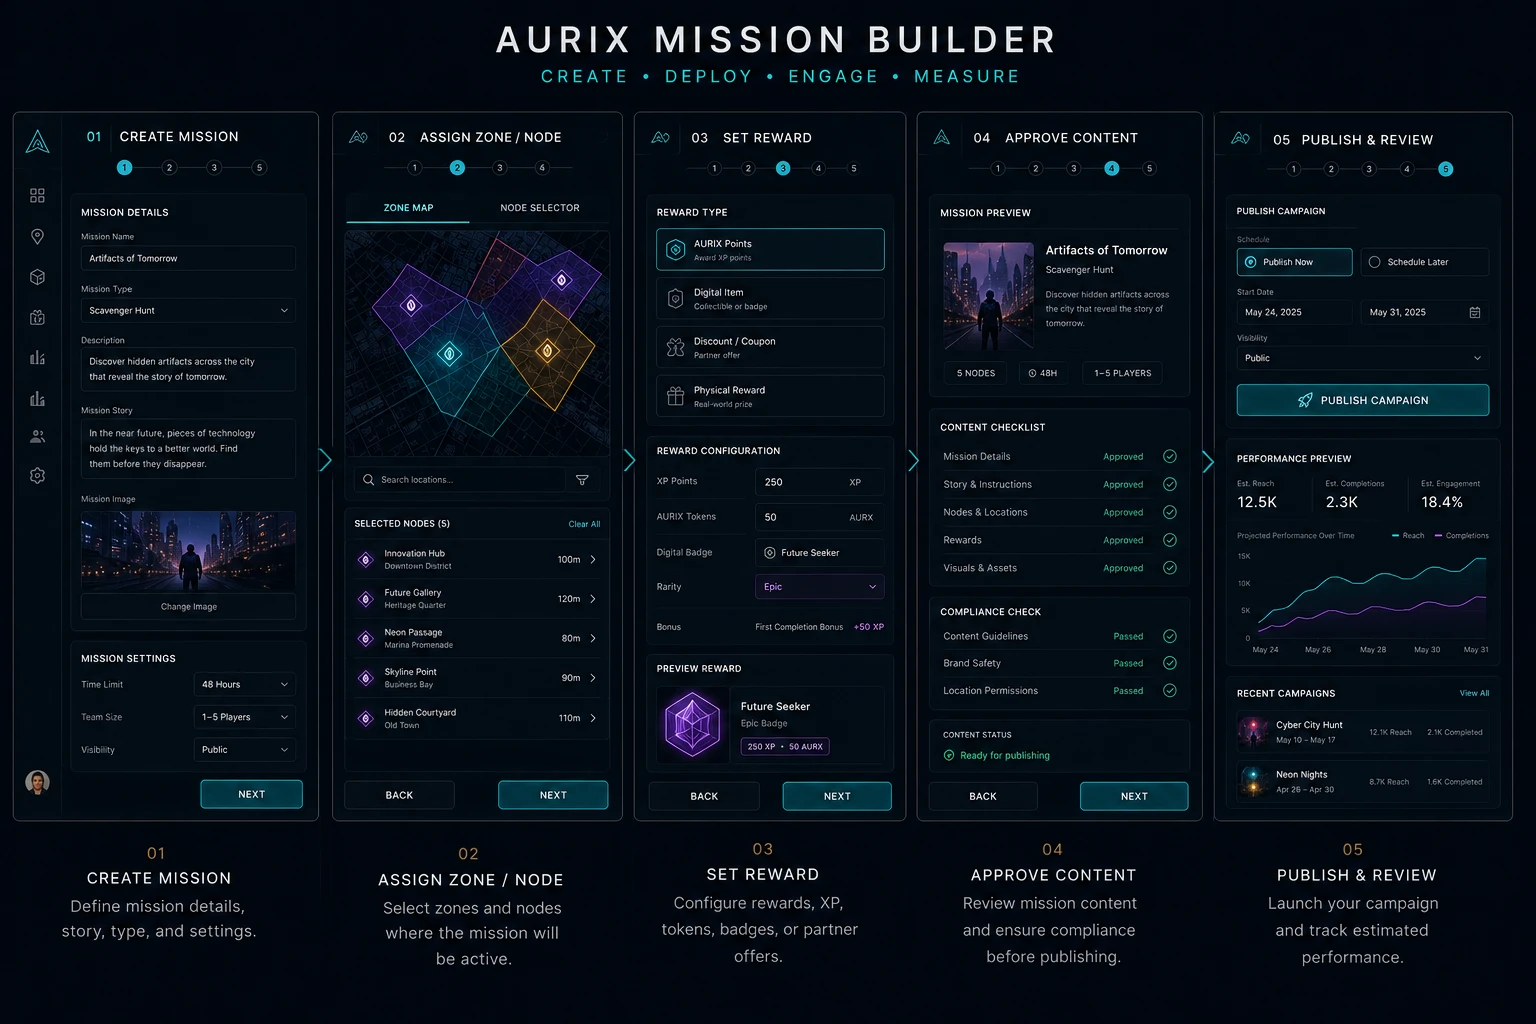
Define foundational mechanics. Input customized storyline briefs, select hunting/scavenger types, configure countdown boundaries, and upload visual asset prompts.
Geofence physical target perimeters. Bind parameters to custom district mapping nodes (e.g., Neon Plaza, Skyline Point) to lock coordinates directly onto local architecture grids.
Configure systemic incentives. Allocate platform experience points (XP), distribute native ecosystem token quantities, inject custom digital badges, or bundle localized retail vouchers.
Automated system compliance checks. Background processing protocols verify campaign parameters against localized regulatory guidelines and structural brand filters.
Go live inside selected district coordinates. Monitor aggregate reach metrics, campaign completion velocity, and view engagement charts adjusting with continuous data updates.
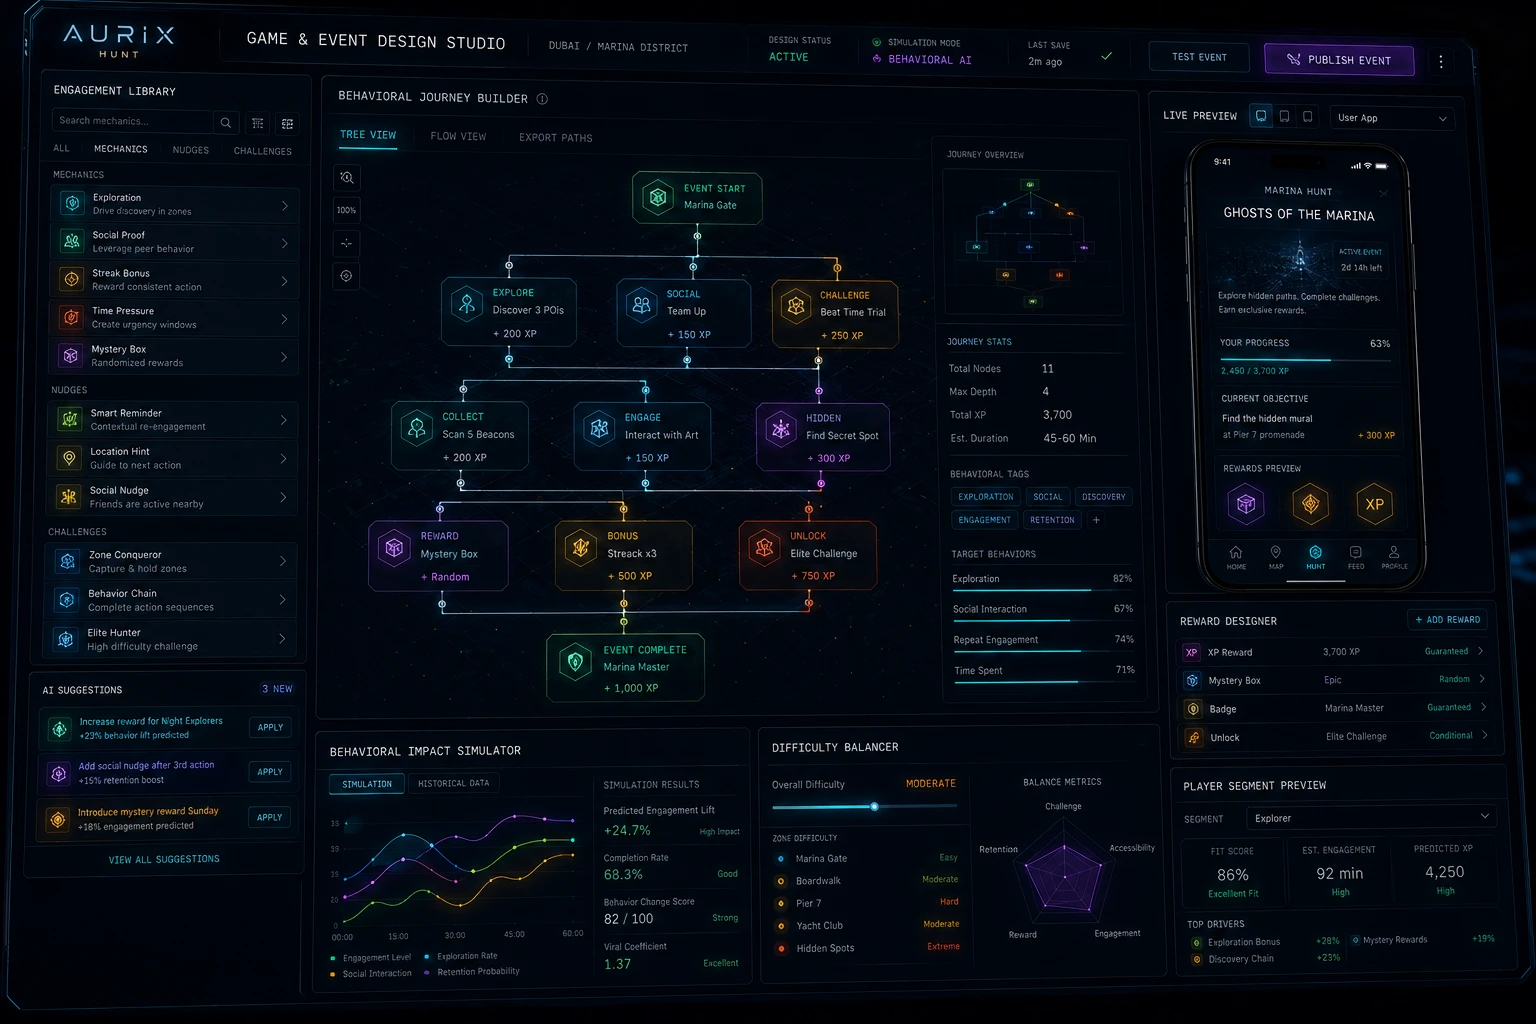
Five highly engaging, repeatable interactive frameworks designed to drive footfall, boost dwell-time, and generate actionable spatial analytics.
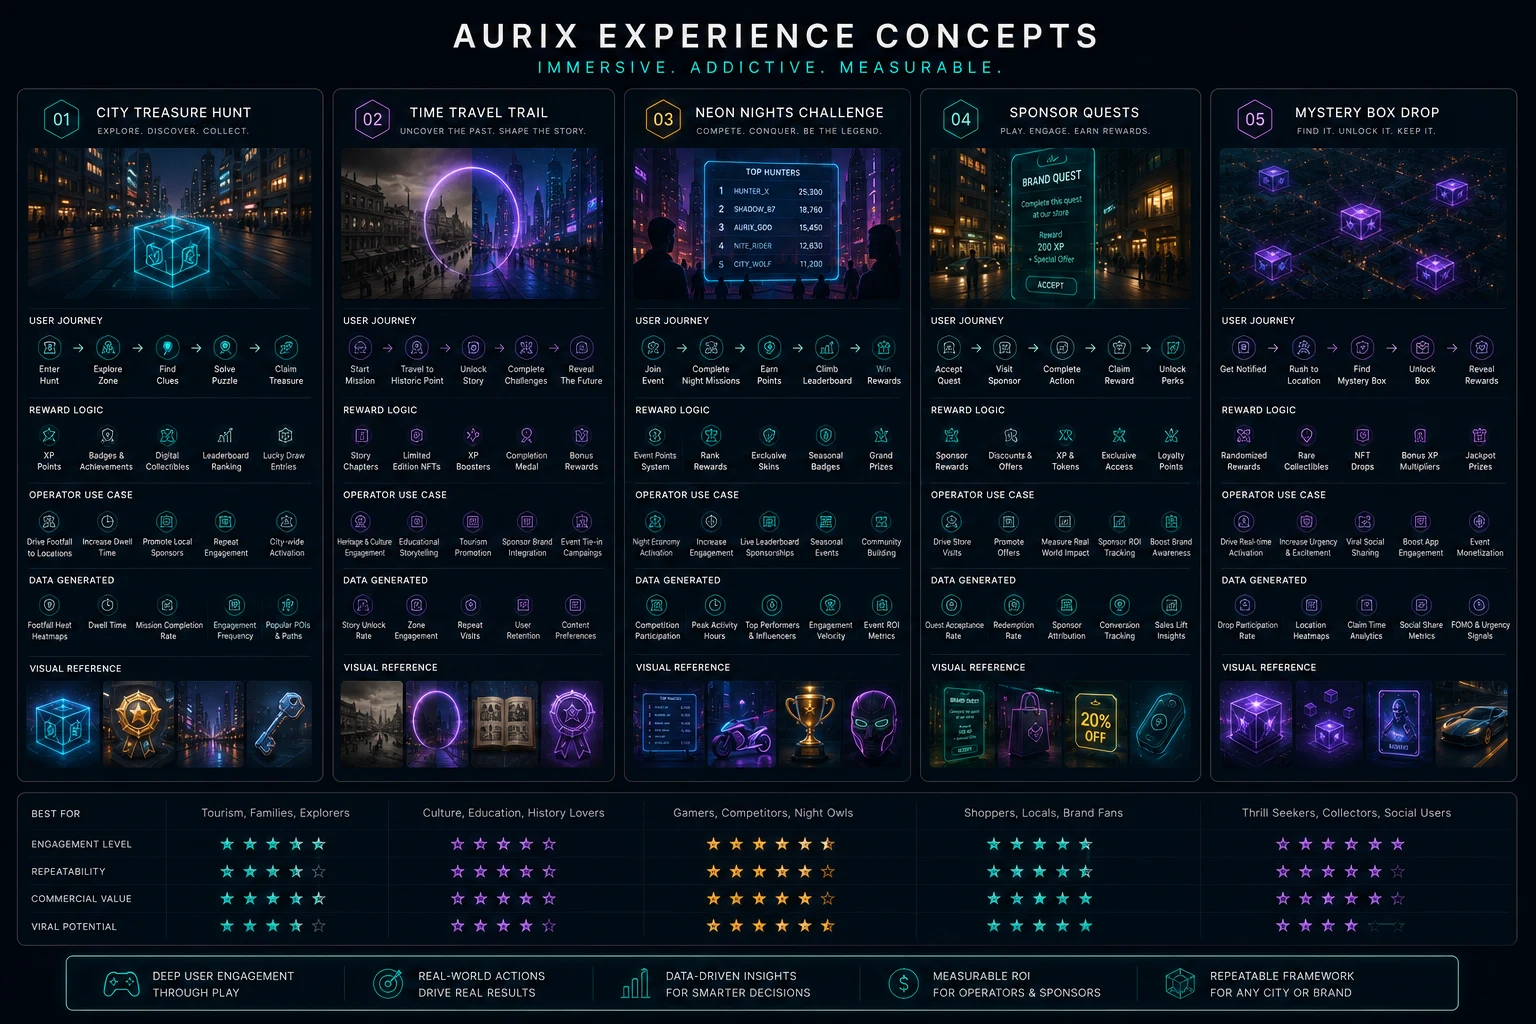
Fully integrated mechanics bridging reward logics, user journeys, operator use cases, and anonymized aggregate data patterns seamlessly.
Users explore physical zones to locate invisible chest coordinates. Solves localized riddle markers to claim digital collectibles and mystery ticket vouchers.
Brings historic checkpoints and architecture to life. Users unlock chronological storytelling chapters, tracking spatial sequences to rebuild virtual monuments.
High-intensity after-dark community challenges. Active leaderboard ladders measure activity-based milestones and progress intervals within specific premium districts to award platform token splits.
Direct commercial activation pipelines. Users complete product scavenger loops inside commercial properties, unlocking real vendor discount metrics and exclusive store privileges.
Time-sensitive, location-locked flash drops creating high viral momentum. Spawns high-tier randomized tokens, premium rare NFT traits, and extreme scarcity assets inside destination vectors.
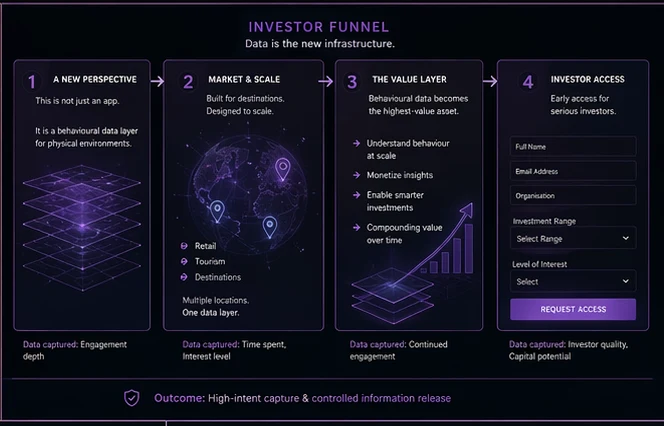
From real-world physical actions to scalable, predictive business intelligence. Witness how raw spatial telemetry transforms into a self-learning optimization loop.
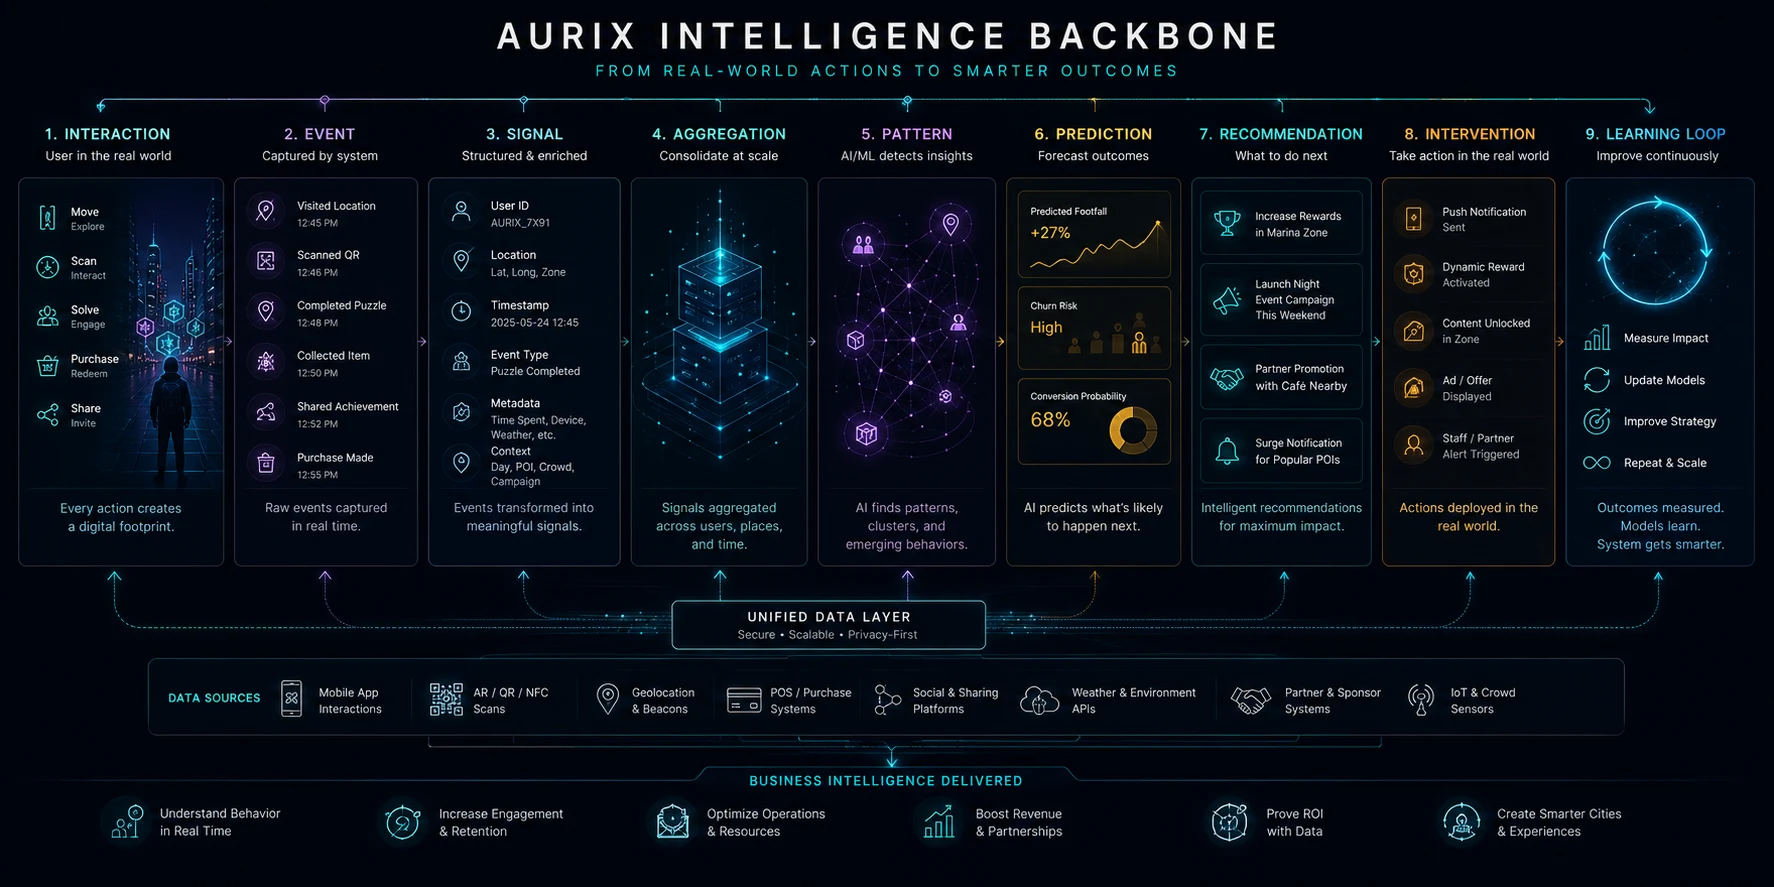
Every real-world movement, AR puzzle solve, or retail scan creates a localized telemetry packet. Raw logs are structured instantly with strict privacy filters.
Data aggregates across users, locations, and vectors. Advanced machine learning layers isolate cluster behaviors, forecast peak footfall density drops, and predict conversion rates.
System flags target recommendations, deploys event-driven zone rewards upon mission completion, updates active parameters, and constantly recalibrates its algorithmic baseline.

AURIX turns physical destinations into interactive, measurable environments, using AR to engage visitors and behavioral intelligence to help operators optimize experience design and drive sustainable value within real-world locations.
Every coordinate triggers historical data and immersive stories. Cities become living museums where users unlock context and cultural lore wherever they stand.
Geo-anchored AR interactions, location discoveries and guided cultural points turn passive visitors into active, informed participants.
Aggregated interaction trends, anonymized visitor patterns and macro interest metrics give authorities and partners powerful insights for long-term strategic decision making.
AURIX transforms premium global complexes into responsive digital-destination environments.
We orchestrate spatial computing layers, volumetric telemetry arrays, and consent-aware interaction pipelines to convert physical venue attendance into anonymized, structured insights and long-term destination engagement loops.
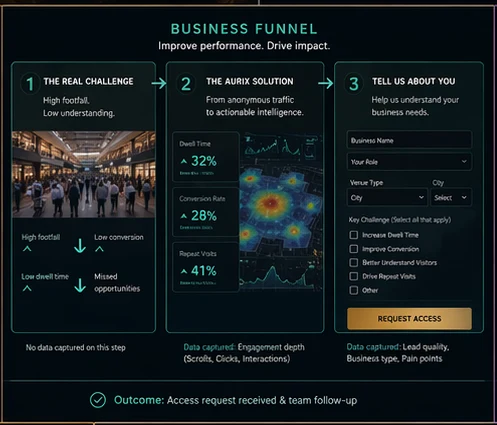
Global mega-districts measure success in Footfall Volume-yet millions of physical visitors leave without ever connecting with the destination's narrative, context, or local partner ecosystem. Raw traffic without conscious interaction limits a venue's true cultural and functional potential.
Geographic coordinates securely stream dimensional assets and background lore. We turn physical boundaries into responsive spatial ecosystems where users unlock context and rewards.
Interaction telemetry maps visitor density purely through aggregated spatial vectors. Built without individual trackers or biometric reliance, ensuring absolute compliance.
Geo-anchored mixed-reality devices and optical modules deployed natively into selected districts. Scale from an isolated micro-perimeter to a multi-venue infrastructure seamlessly.
Three paths. One intelligent platform.
Select the path corresponding to your professional vertical to initiate the registration process. Our ecosystem operates under a strict closed framework: upon submitting your data, your request undergoes a manual vetting procedure. Once integrity verification is successful, your customized, secure system credentials will be issued.
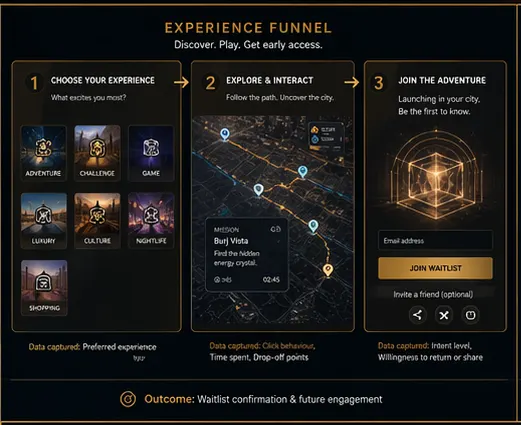
Discover. Explore. Solve. Earn.


Real-Time Intelligence. Measurable Impact. Operator Control.
// Architectural payload taxonomy transforming interaction vectors into scalable, high-fidelity sovereign data assets.


Our architecture transforms spatial ecosystem dynamics into actionable operational insights, built entirely upon explicit user permission and absolute privacy sovereignty.
All localized spatial mapping and ecosystem interactions operate strictly via transparent opt-in frameworks. Immersive experiences remain fully controlled by the user.
We process only the fundamental spatial performance vectors required to render the viewport context, measure aggregated engagement, and support precinct health.
Operator dashboard streams process macro-level trends. High-fidelity analytics focus entirely on zonen-based crowd densities and patterns rather than personal identity tracking.
System core infrastructure guarantees full isolation. Consumer front-ends, precinct operator management panels, and platform analytics act via structurally separated environment arrays.
Advanced algorithmic model matrices, custom enterprise integration configurations, and precinct development plans remain securely encrypted and selectively accessible.
Ethical data handling is our structural core advantage. Empowering users with verifiable data control ensures high organic response and premium, unsullied ecosystem analytics.
Our multi-layered workflow transforms safe real-world actions into high-value precinct analytics without compromising or referencing personal identity.
Structured, non-personal parameters evaluated by our engine to build compliant, institutional-grade analytics frameworks for partners.
Scaling a multi-district destination framework shouldn't require immediate system-wide disruption. Our architecture is fundamentally engineered for isolated testing. With the One-Zone Pilot protocol, venue operators can launch, evaluate, and audit spatial activation dynamics within a single localized perimeter before deploying across full-scale complexes.
Define a high-traffic micro-zone (e.g., a single atrium, flagship showroom, or specific plaza) to isolate local interaction analytics.
Activate custom localized anchors or initialize secure edge pass-through processing nodes instantly within the isolated sandbox boundaries.
Monitor anonymous trend graphs, evaluate structural visitor interaction spikes, and assess gamified pathfinding metrics directly from your operator control dashboard.
Ready to securely initialize your partner profile and claim a compliant operational micro-zone test frame? Select the Operator path below.
Our spatial intelligence architecture processes precinct performance metrics with mathematical objectivity, ensuring uncompromising protection of user identity.
Every digital crossover within the spatial environment relies strictly on clear, intentional user initiation. Activation metrics are processed exclusively upon explicit validation, guaranteeing that the audience retains complete sovereignty over their local interactions.
Our framework operates purely on macro-level analytics. All spatial context paths are fully aggregated at the point of ingestion by default. We do not evaluate, record, or store individual biometric patterns, face structures, or personal markers.
Built strictly around the foundational doctrine of data minimization. Structural precinct dashboards are strictly isolated via secure, role-based access tokens. Data scopes are never broad-cast; they are accessible only to qualified ecosystem operators.
A strategic high-level breakdown of architectural stages, spatial framework validation, and conceptual destination scaling.
Initialization of the primary interaction framework. Evaluation of the WebGL 3D Spatial Twin and baseline user routing logic.
Onboarding closed evaluation modules for destination operators. Scaling permissioned aggregation tools for anonymous spatial insights.
Conceptual edge interface prototyping. Aligning interactive hardware test environments with the digital visualization layer.
Evaluating commercial partner rewards, program integrations, and curated pilot events within regional partner venues.
PLANNED REGIONAL NODES • PROJECTED DATA POINTS
Simulation Framework Parameters Updated Natively
SCENARIO VIEW: PILOT INFRASTRUCTURE - Illustrative Data Compilation Only
>> Genesis Node Primary Uplink
Registration Requested
By entering, you accept our terms of service and consent-aware data management.
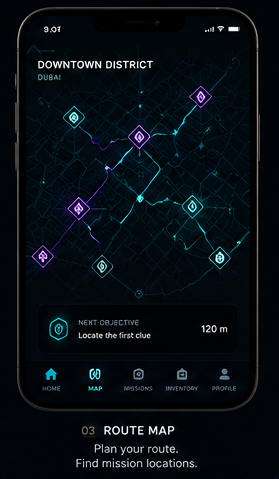
The surface is designed for visitor engagement – blending digital storytelling, seamless navigation, and contextual interaction. It serves as the rich, interactive interface of the physical location.
The intelligence layer underneath provides the structural baseline for destination management. Every interaction utilizes completely anonymous, aggregate metrics to assist in volume forecasting and asset allocation. We focus on enhancing spatial design through privacy-first, consent-aware parameters to deliver a highly optimized environmental workflow.
Select Your Layer Below
Getting integrated is simple. Our team maps your location using open 3D architectural standards and links it directly to our spatial coordinate system. Once your zone is activated, you can begin anchoring custom quests, launching immersive product visualization scenes, or offering digital rewards directly from your business dashboard.
Yes, by design. By routing interactive gamified quests through a venue, Aurix encourages users to actively discover spaces. Analytical simulation models within the architectural design process indicate a projected +20% increase in average spatial engagement times and an improved interaction baseline for digital partner campaigns.
Zero hardware installation is required on your premises. The entire spatial interaction layer runs completely on the cloud and streams natively inside the user's standard mobile browser. Your business does not need to deploy, configure, or maintain any expensive on-site devices.
No app stores, no massive downloads. Aurix is built entirely on advanced WebXR tech, meaning it opens instantly within Safari or Chrome on your current smartphone. Simply scan a portal's local QR code or tap an access link to jump directly into the visualization experience.
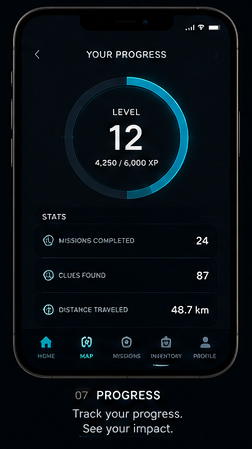
Quests are location-based interactive missions scattered across participating regional hotspots. By exploring specific visualization zones, solving challenges, and interacting with spatial milestones, you earn platform XP and digital items. High-level accounts can unlock partner rewards, including dining vouchers, venue access, and promotional merchandise.
Our engineering framework uses streamlined progressive data pipelines to render 3D elements smoothly. Because the complex spatial calculations are optimized and structured efficiently, local device battery drain is kept minimal, comparable to streaming a standard web video.
Ready to activate your location or start your exploration track?
Access to regional visualization environments requires regular profile initialization. Complete your track assignment via the Funnel Registration above to launch the interactive browser environment.
Framework deployment scheduled for Phase 02.
Sector 04 Blueprint
Spatial model parameter assessment Pending.
Verified platform specification detailing the current operational client framework and scheduled system scaling layers.
Active Operational Baseline: The client-facing landing interface, user segment routing engines, and profile initialization components are fully built and deployed across global edge-CDN nodes. The current system environment runs on an optimized HTML5/TailwindCSS presentation tier executing local parameter verification hooks.
Target Integration Infrastructure: The upcoming backend pipeline moves to a modular Next.js application layer processing real-time render queries via a microservices engine (Go/Node.js). Persistent application layers will utilize PostgreSQL for transactional integrity alongside a low-latency Redis caching fabric. Encrypted identity gating is designed around federated OAuth2 / OpenID Connect access models.
The platform architecture distributes system request streams across three independent processing tracks to maximize performance:
The core data schema evaluates technical system parameters to optimize scene asset streaming and platform performance bounds:
Decision-Support Paradigm: The dashboard environment is engineered to assist operators with structural capacity management. It provides actionable system data regarding spatial load forecasts, global asset distribution, and backend hardware infrastructure responses.
| System Metric | Primary Data Source | Sync Cadence |
|---|---|---|
| Active Node Rendering Capacity | WebXR Pipeline Protocols | Real-Time Data Streams |
| Platform Engagement Quantifiers | Relational Ledger Engine | Hourly Batch Cycles |